Is Miami’s Offense Fraudulent in Bad Weather?

miami
dolphins
nfl
Author

Natalia Guerrera

Published

May 1, 2025

The Miami Dolphins continue through their seasons known for their home-field advantage with the Florida heat. With blazing temperatures and clear skies, they looked unstoppable after dominating opponents when it is warm. As the season cooled down, so did their production. The team that seemed untouchable in the sun began to struggle in colder weather conditions. This brings up the question: Is Miami’s Offense Fraudulent in Bad Weather?

Code
weather_data <- data.frame(
  Week = 1:18,
  Temperature = c(91,87,66,87,64,NA,66,83,51,64,82,77,27,78,80,75,61,31),
  Weather = c("Clear", "Clear", "Clear", "Clear", "Cloudy", NA, "Clear", "Cloudy", "Cloudy", "Clear", "Overcast", "Clear", "Overcast", "Cloudy", "Cloudy", "Clear", "Rain", "Clear"),
  Q1 = c(0,7,3,0,3,NA,7,10,3,7,7,0,0,6,0,3,3,6),
  Q2 = c(7,3,0,3,0,NA,3,3,7,3,3,24,3,9,6,10,3,0),
  Q3 = c(7,0,0,3,6,NA,0,7,3,7,7,7,8,0,6,6,7,0),
  Q4 = c(6,0,0,6,6,NA,0,7,14,6,17,3,6,11,0,10,7,14)
)

weather_data <- subset(weather_data, !is.na(Temperature))

weather_data$Weather_Type <- ifelse(
  weather_data$Temperature > 55 & !(weather_data$Weather %in% c("Rain", "Overcast", "Snow")),
  "Good", "Bad"
)

weather_types <- unique(weather_data$Weather_Type)
quarters <- c("Q1", "Q2", "Q3", "Q4")
avg_list <- list()

for (wt in weather_types) {
  subset_data <- weather_data[weather_data$Weather_Type == wt, ]
  avg_points <- colMeans(subset_data[, quarters], na.rm = TRUE)
  avg_list[[wt]] <- data.frame(
    Quarter = quarters,
    Average_Points = avg_points,
    Weather_Type = wt
  )
}

quarterly_averages <- do.call(rbind, avg_list)

library(ggplot2)
ggplot(quarterly_averages, aes(x = Quarter, y = Average_Points, group = Weather_Type, color = Weather_Type)) +
  geom_line(size = 1.5) +
  geom_point(size = 3) +
  labs(title = "Heating Up or Cooling Off?",
       subtitle = "How weather conditions influence scoring consistency throughout the game.",
       x = "Quarter",
       y = "Average Points",
       caption = "By Natalia Guerrera | Source: Sports Reference",
       color = "Weather Type") +
  theme_minimal()

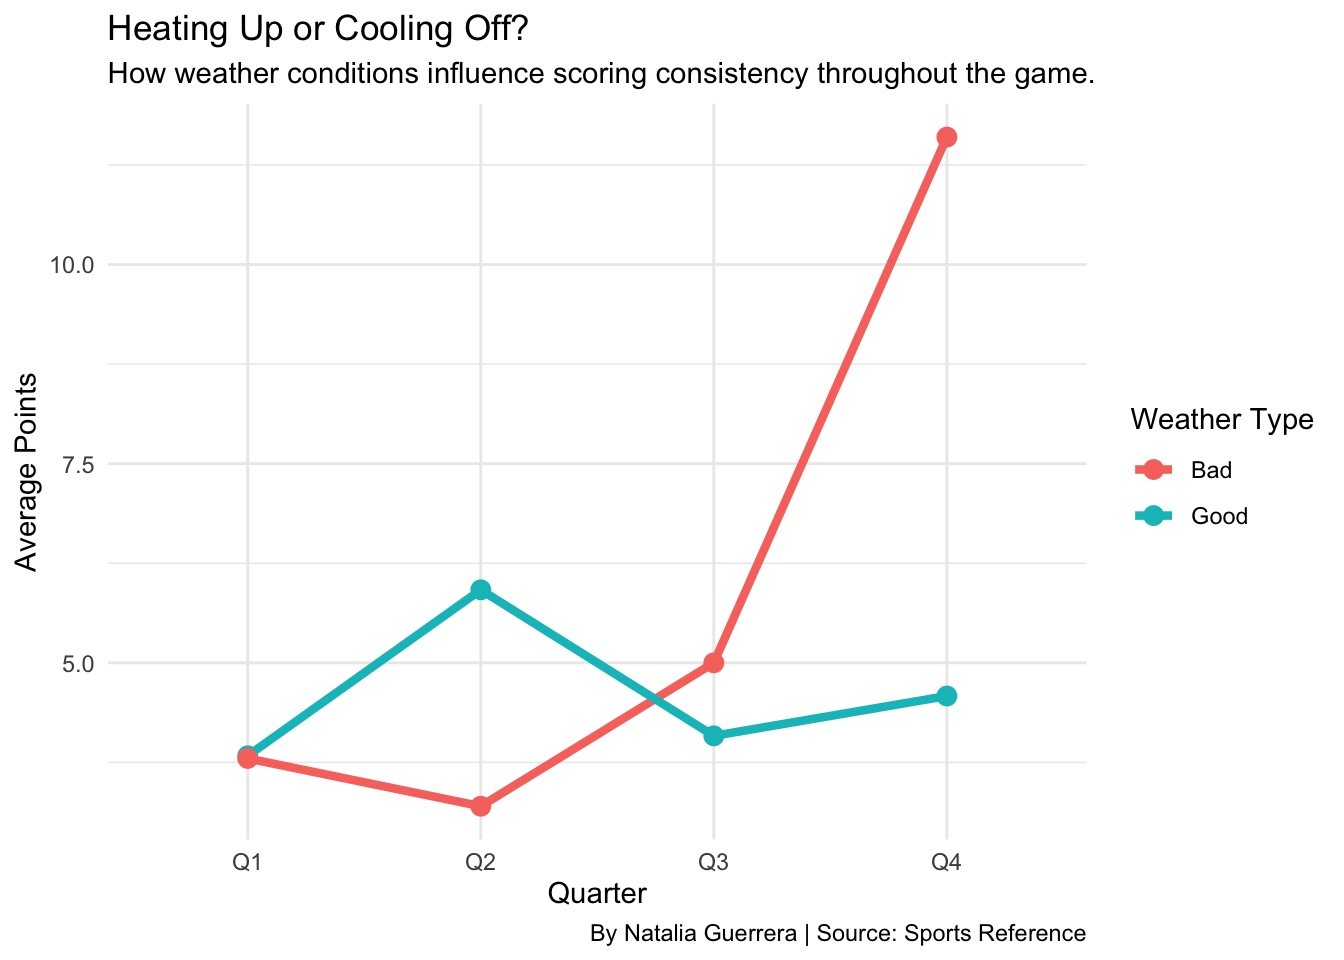
The line graph illustrates how weather impacts scoring by quarter. In good weather, teams score steadily across all four quarters, with noticeable peaks in the second. In contrast, bad weather suppresses scoring in the early quarters. Interestingly, there’s a spike in the fourth quarter during bad weather games that suggest late-game urgency or defensive fatigue may influence outcomes despite poor conditions.

Code
library(tidyr)

cold_weather_summary <- data.frame(
  Temperature_Range = c("45 degrees or less", "Greater than 45 degrees"),
  Wins = c(0, 36),
  Losses = c(8, 16)
)

cold_weather_long <- pivot_longer(
  cold_weather_summary,
  cols = c("Wins", "Losses"),
  names_to = "Result",
  values_to = "Games"
)

ggplot(cold_weather_long, aes(x = Temperature_Range, y = Games, fill = Result)) +
  geom_bar(stat = "identity", position = "stack") +
  scale_fill_manual(values = c("Wins" = "#008E97", "Losses" = "#FC4C02")) +
  labs(
    title = "Tua Tagovailoa’s Cold Weather Struggles",
    subtitle = "Tua is 0-8 when the temperature is 45°F or colder and 
36-16 when it's greater than 45°F.",
    x = "Temperature at Kickoff",
    y = "Number of Games",
    caption = "By Natalia Guerrera | Source: Sports Reference",
    fill = "Game Result"
  ) +
  theme_minimal(base_size = 14)

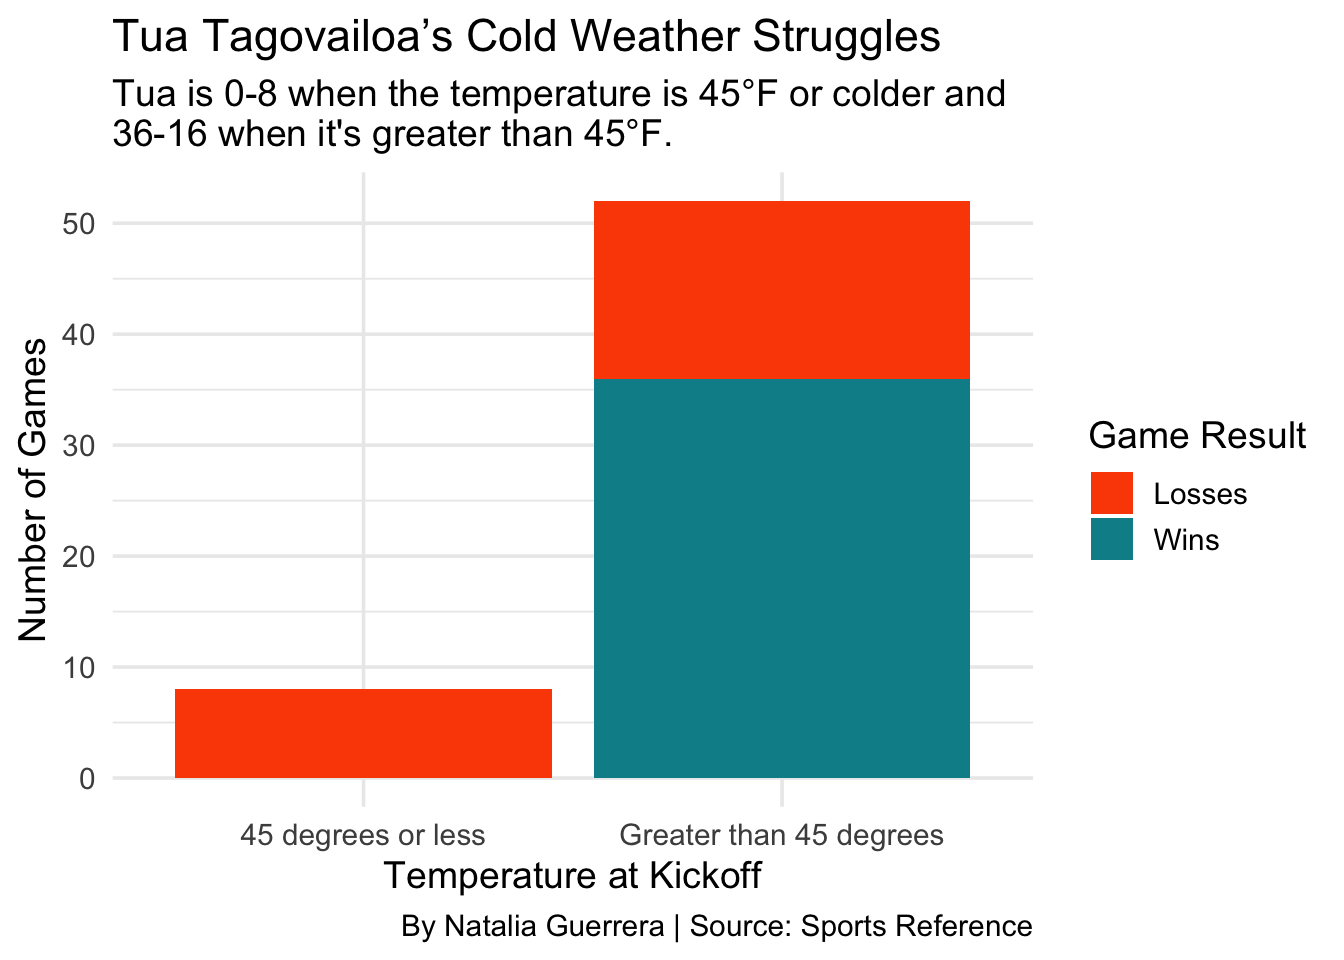
This graph higlights Tua Tagavailoa’s struggle when it comes to weather that is less than 45 degrees at kickoff. In cold conditions, he has yet to win a game, going 0-8 over his career. When the temperature is greater than 45 degrees, Tagovailoa has a strong 36-16 record, showing a clear performance gap due to climate.

Code
weather <- c("Heat", "Cold")

offense_yards <- c(4701, 2121)
defense_yards <- c(3239, 1926)
points_scored <- c(372, 124)
points_allowed <- c(209, 182)

games_heat <- 12     
games_cold <- 6     
avg_offense_yards <- c(offense_yards[1] / games_heat, offense_yards[2] / games_cold)
avg_defense_yards <- c(defense_yards[1] / games_heat, defense_yards[2] / games_cold)
avg_points_scored <- c(points_scored[1] / games_heat, points_scored[2] / games_cold)
avg_points_allowed <- c(points_allowed[1] / games_heat, points_allowed[2] / games_cold)
par(mfrow = c(1, 2), oma = c(4, 0, 2, 0), mar = c(5, 4, 4, 2), cex.main = 0.9, cex.lab = 0.8, cex.axis = 0.8)

barplot(
  rbind(avg_offense_yards, avg_defense_yards),
  beside = TRUE,
  col = c("steelblue", "firebrick"),
  names.arg = weather,
  ylim = c(0, max(avg_offense_yards) + 500),
  main = "Yardage Allowed",
  ylab = "Yards (Per Game)",
  cex.names = 0.8
)
legend("topright", legend = c("Offense Allowed", "Defense Allowed"), fill = c("steelblue", "firebrick"), cex = 0.7)

barplot(
  rbind(avg_points_scored, avg_points_allowed),
  beside = TRUE,
  col = c("darkgreen", "orange"),
  names.arg = weather,
  ylim = c(0, max(avg_points_scored) + 10),
  main = "Scoring Freeze",
  ylab = "Points (Per Game)",
  cex.names = 0.8
)
legend("topright", legend = c("Points Scored", "Points Allowed"), fill = c("darkgreen", "orange"), cex = 0.7)

mtext("By: Natalia Guerrera | Source: Sports Reference", side = 1, outer = TRUE, line = 2, cex = 0.8)
mtext("By: Natalia Guerrera | Source: Sports Reference", 
      side = 1, outer = TRUE, line = 4, cex = 0.8, font = 3)

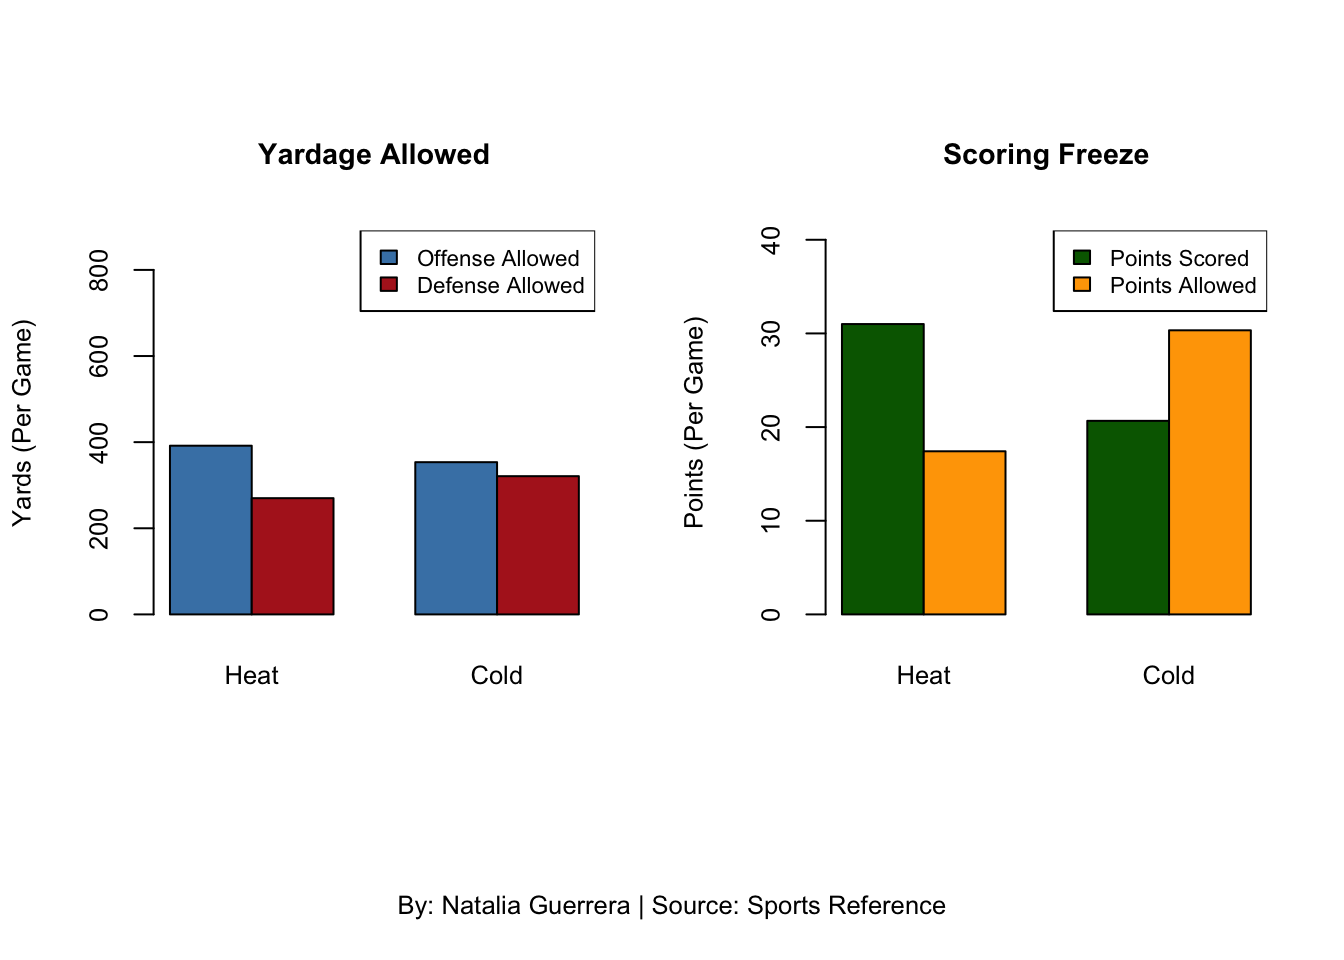
This graph shows that the Miami offense performs significantly better in warm weather, gaining more yards and scoring more points compared to cold conditions. Meanwhile, their defense allows slightly fewer yards in cold games but gives up nearly the same number of points. Overall, the data suggests that Miami struggles offensively in colder weather, highlighting a difference in performance based on temperature.

The Miami Dolphins struggle significantly in cold weather, both in terms of game outcomes and offensive production. The offensive production is the big struggle when it comes to winning games that have a colder environment. Looking at Tua Tagovailoa we see that he does not thrive in cold weather ultimately hurting the rest of the teams performance.

Altogether, the data supports the claim that cold weather hurts Miami’s overall performance, especially offensively. The consistent trends across this data support that Miami’s reputation for under performing in the cold is the truth.